| TEBER.biz | | Home | Turkish | | |||||||
| >> 3DMath Explorer | ||||||||
|
||||||||
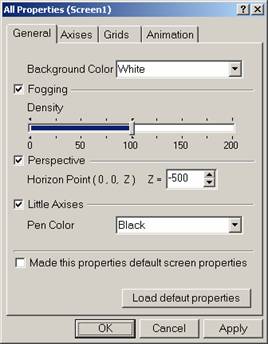
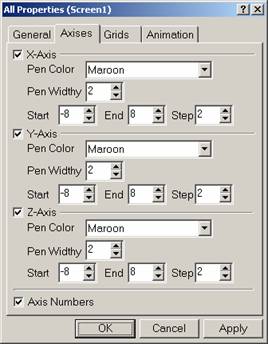
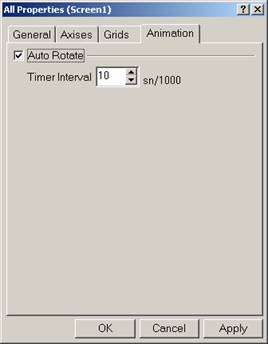
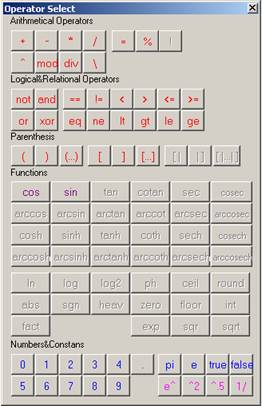
| ||||||||||||||||||||||||||||||||||||||||||||||||||||||||||||||||||||||||||||||||||||||||||||||||||||||||||||||||||||||||||||||||||||||||||||||||||||||||||||||||||||||||||||||||||||||||


| Questions or
problems regarding this web site should be directed to info@teber.biz. Copyright © 2002 Dursun TEBER. All rights reserved. ( http://www.teber.biz ) Last modified: 15/09/2002. |